This page is more than three years old.
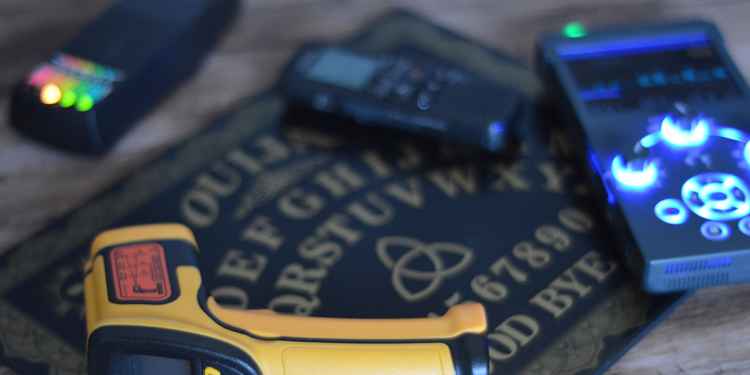
Electronic Voice Phenomenon (EVP) are the mysterious sound of disembodied human-like voices of unknown origin that are heard through electronic devices.
Recording EVPs during an investigation is reasonably straight forward, but things can become a little more complicated when it comes to analysing your recordings in an attempt to identify any potential spirit voices contained within them.
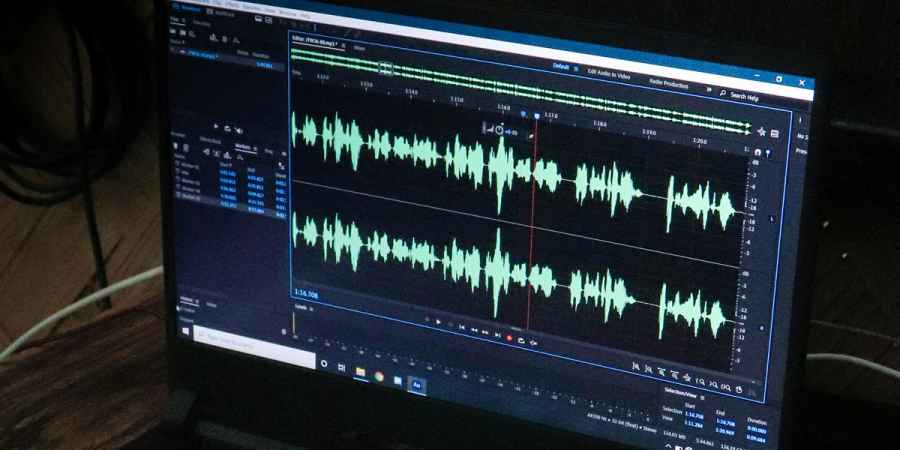
The review and analysis of EVPs is normally carried out using free audio editing software like Audacity, or the more professional software Adobe Audition.
These applications generally show you the sound represented as a waveform by default. This view can tell us a lot about the sound it represents, but it doesn't tell us the whole story, which is where the spectrogram view comes in.
The Difference Between Waveforms & Spectrogram
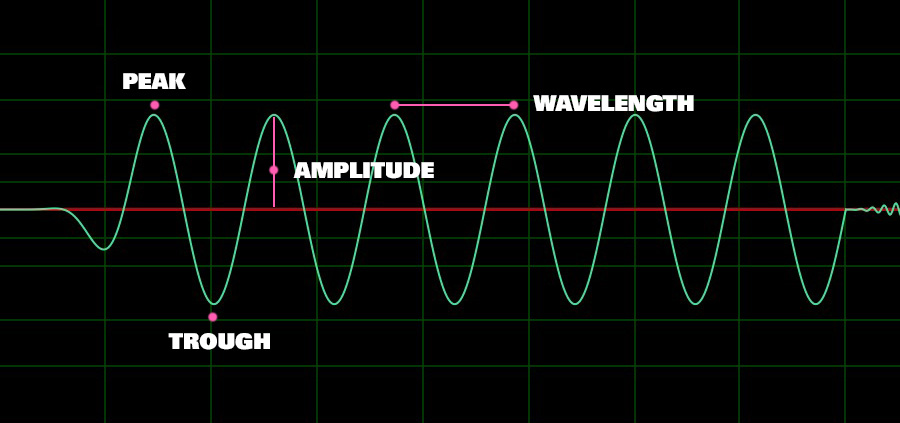
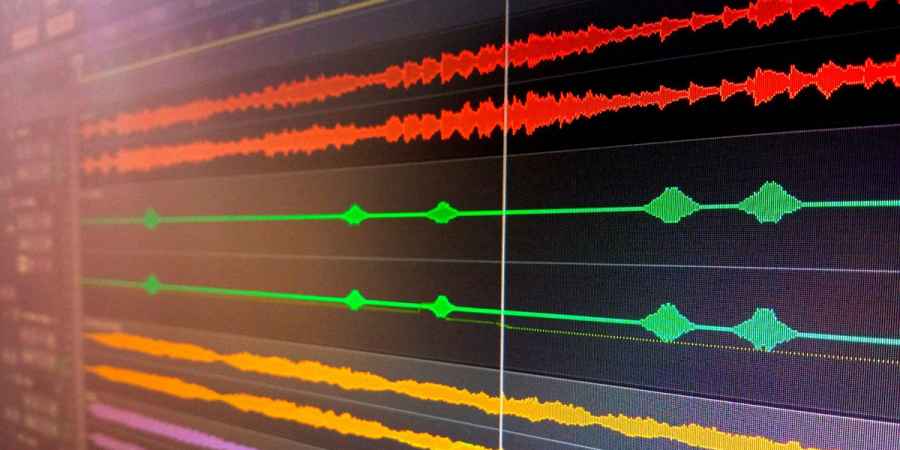
The height of a waveform tells us how loud or quiet the sound is - the amplitude - and the horizontal axis of a waveform tells us the duration of the sound, but one thing that cannot be immediately determined from a waveform is the sound's frequency.
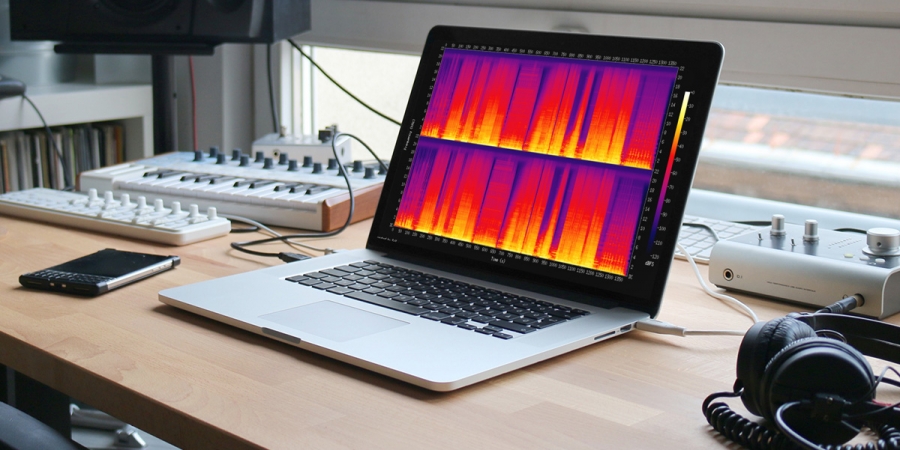
Switching to the spectrogram view, sometimes called the spectral frequency display, gives you a better understanding of which frequencies are present in a recording. Rather than being presented with a waveform you will see what looks like a heat map. This is an overview of the audio from which you can determine the volume and different frequencies present in a recording throughout its duration.
Whereas in a waveform view the vertical axis represents the amplitude of the sound, in a spectral frequency display the vertical axis represents the frequency range, while the horizontal axis still represents time.
The lighter areas on the display represent louder sounds, the sound's vertical placement in the graph shows us the frequency of the sound.
If there is a higher density of light patches at the top of the display, then this represents a high pitched sound. A similarly dense area at the bottom of the display represents a low pitch sound. This view can make it easier to pick out human voices, low pitch, or high pitch sounds at a glance - something you can't do with a waveform view.
Advertisement ‐ Content Continues Below.
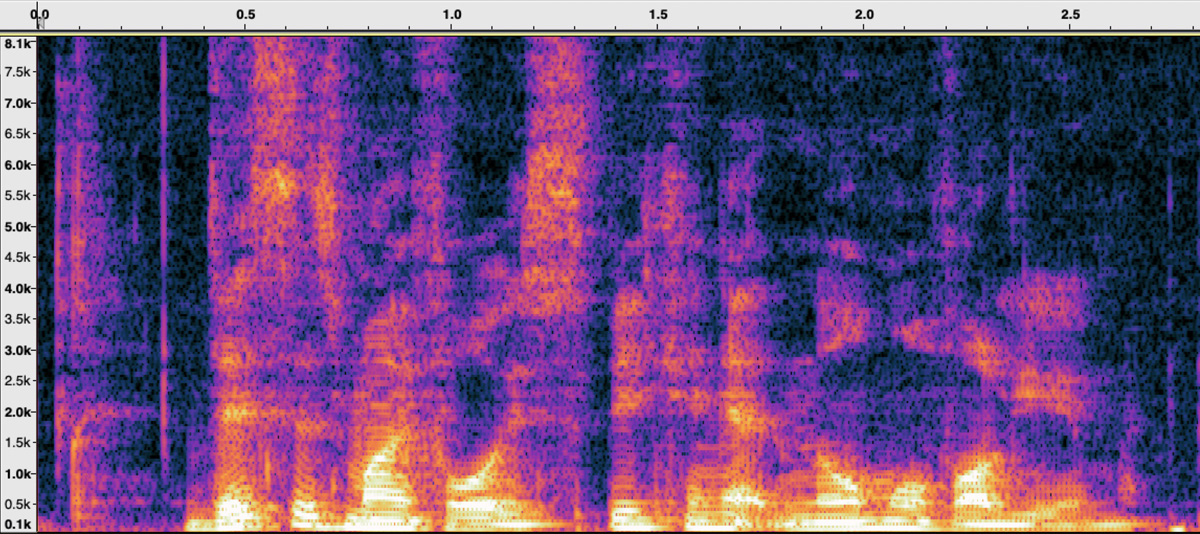
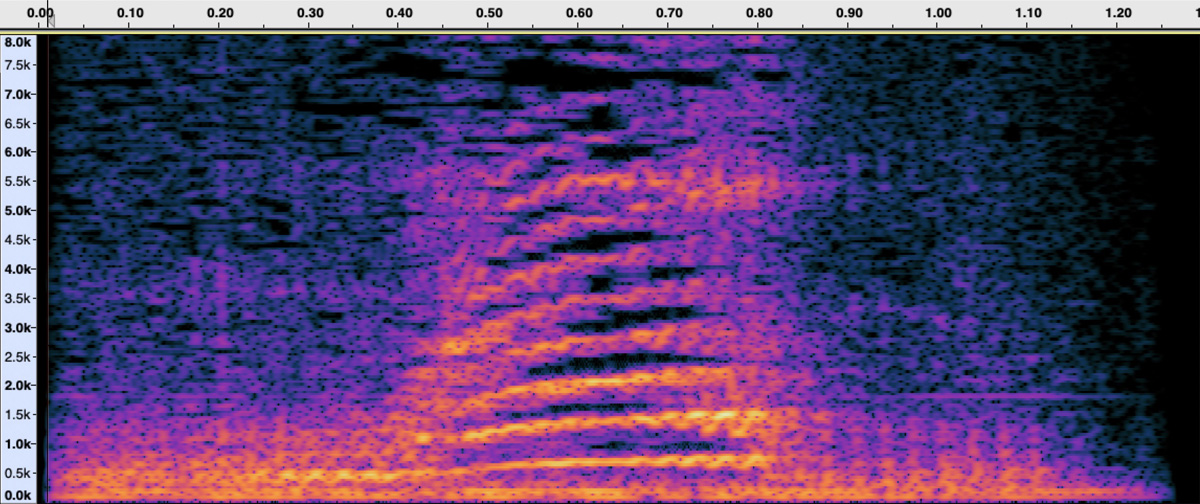
The spectrogram above represents a human voice. Speech has a characteristic look which you will be able to recognise with a bit of practice as it always falls within a certain frequency range and therefore roughly the same vertical placement on a spectrogram.
A male voice has an average frequency of 125Hz, while a female voice is around 200Hz. However, we don't speak in a monotone, the pitch of our voices fluctuates and the voice spans a frequency range up to as high as 8KHz.
In the example above you can see that the speech is mostly concentrated below the 500Hz mark, but there are elements of the speech which reach as high as 6KHz in this example.
Recognising these patterns will make it easy for you to pick out a voice amongst noice. Let's take a look at some noise.
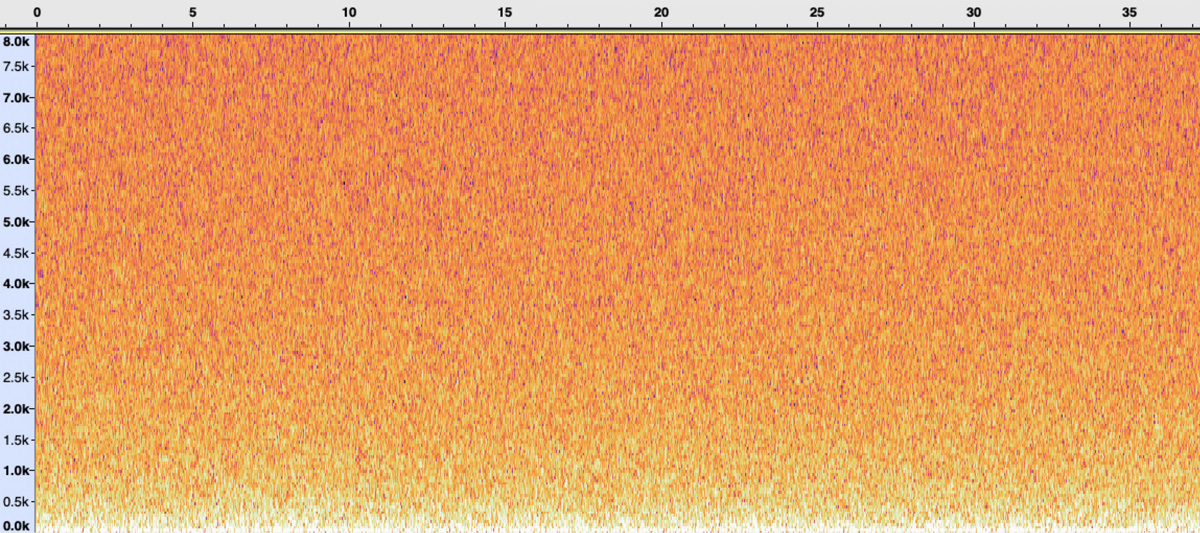
This spectrogram shows pure white noise. It is made up of random sounds across the whole spectrum of frequencies, which gives the spectral frequency display a very uniform look across both the frequency and time axis.
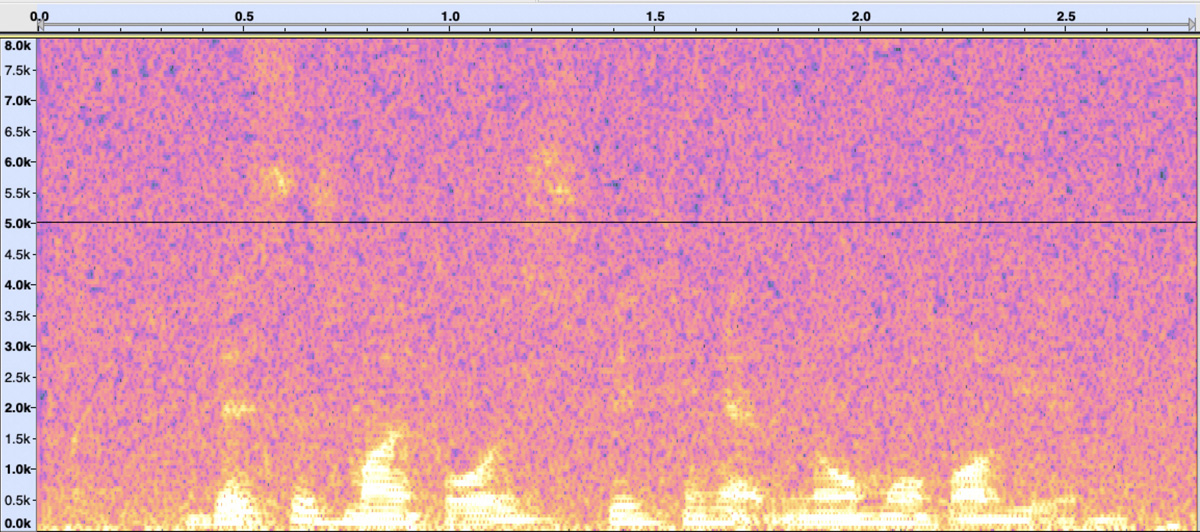
If we mix the previous two examples together so that the voice is playing over the white noise, we get a spectrogram that looks like the example below.
Although there is the same amount of white noise in the example above, it is still clear to see where the voice lies in the recording. Understanding which parts of the spectrogram contain a human voice can be very useful for isolating voices and removing background noise.
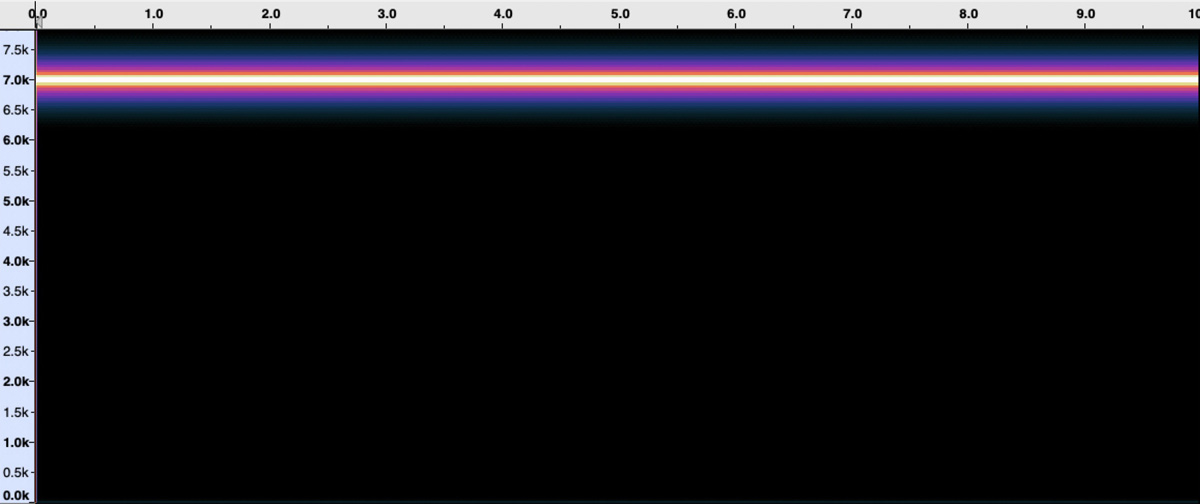
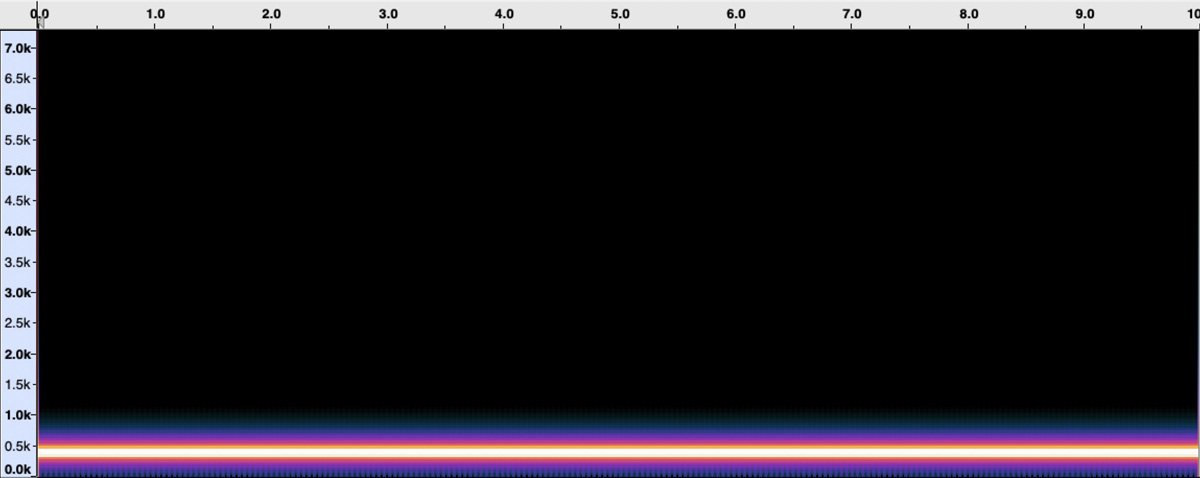
To create the spectrogram above we generated a pure clean high frequency tone. You can see that the only sound in the recording is this tone, which sits around the 7KHz mark and lasts for the full duration of the recording. The black portions of the display show that there are no sounds at all within these frequency ranges.
The spectrogram below was created in the same way but with a 400Hz tone, which you can see this low-frequency sound towards the bottom of the spectral display. Again, the large black portions shows there are no high frequency sounds present.
Often unwanted noise in recordings will be high-pitched hiss, or low-end rumble, so understanding how to identify noises across the frequency ranges will enable you to isolate those sounds and remove them from the recording without affecting the speech you're trying to preserve.
You can remove or reduce these unwanted sounds by highlighting the specific frequency range and duration in the recording, then either removing it by pressing delete or cut, or by reducing the volume to zero. Tools like the 'spot healing brush' can also help you to seamlessly remove unwanted sounds with as little disruption to the rest of the recording as possible.
The spectrogram above doesn't show a human voice, it actually represents a cat's meow. You can see that the shapes of the sounds are quite different, they are more uniform in the case of the meow and the sound is made up of more high frequency tones.
Understanding the frequency that sounds are made up of can be very helpful when analysing EVPs. If you capture a voice in your recording then a spectrogram will tell you one of two things, either the voice falls within the normal frequency range of human speech, or the voice does not match the tone of a normal human voice.
Since so little is known about the nature of EVPs, where the voices come from and how they are captured, this information can be interpreted in several different ways.
If a suspected
EVP has the signature of a normal human voice, then this could tell you that you have capture the voice of a spirit as they may have sounded in life. It could also tell you that the EVP is the result of radio interference - a real human's voice bleeding through into the recording, or it could be the voice of someone present at the investigation.
It may be that the voice is made up of background noise or ambient sounds that have been transformed by having their pitch changed to form words.
If you hear a voice in your recording and then upon inspection in a spectral view determine that it is higher or lower pitched than a normal human voice, then this tells you that it is not the voice of a living person on the investigation or radio interference.
This leaves you with a few possibilities, the first is that it isn't a voice at all and that this is an example of auditory pareidolia. The second possibility is that spirits don't communicate using the voice they had when they were alive, or that through some strange quirk of recording the voice's pitch has been shifted.
The other possibility is that non-human voice range sounds have been manipulated to form words. This could have been done in a way that the original pitch of the sound has been preserved but the sounds have been altered to form words or sentences.
Although there's no clear way to tell exactly what is going on in these situations, as a good researcher you should be aware of the frequency ranges of EVPs, not only to help you debunk or validate evidence, but also to look for trends in the evidence captured in order to help further the field of EVP research.
Depending on which software you use, sometimes the spectral view will be a 3D representation of the sound, with frequency, amplitude and time along the three axis. More commonly it is a two dimensional representation as described above with time along the horizontal axis and frequency on the vertical.
More On EVP Research
See All
Learn With Higgypop
Hosted by Paralearning in association with Higgypop, these courses on ghost hunting, paranormal investigations, and occult practices draw on the experience of our team of paranormal writers.
Diploma In Practical Ghost Hunting & Scientific Analysis
This course gives you practical and useful knowledge of ghost hunting and paranormal research, which is invaluable when conducting your own paranormal investigations or as part of a group event.
View Course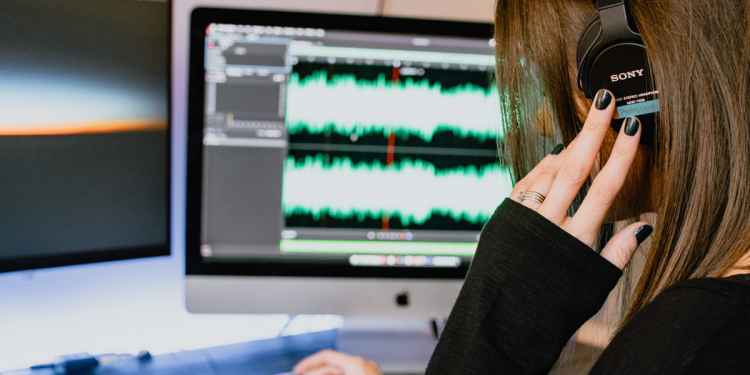
Diploma In Capturing & Analyzing Electronic Voice Phenomenon
This course gives you practical and useful knowledge of ghost hunting and paranormal research, which is invaluable when conducting your own paranormal investigations or as part of a group event.
View Course

Comments
Want To Join The Conversation?
Sign in or create an account to leave a comment.
Sign In
Create Account
Account Settings
Be the first to comment.